
Harnessing Mathematical Prowess for Enhanced Business Management and Organizational Efficiency
- Supratim Kundu
- Feb 11, 2024
- 4 min read

Introduction: In the modern business landscape, the integration of mathematical modeling has become essential for optimizing decision-making processes across diverse domains within organizations. This essay delves into the multifaceted applications of mathematical modeling in business management, spanning revenue management, customer service, marketing strategies, product management, customer experience, sustainability initiatives, strategic management formulation, dynamic pricing, merchandising decisions, and hiring practices.
Revenue Management: Mathematical models, particularly the Price Elasticity Model, are instrumental in revenue management. The Price Elasticity Model can be represented as:

Here, E denotes price elasticity, which quantifies the responsiveness of demand to price changes. By analyzing historical sales data and market dynamics, businesses can estimate price elasticities and determine optimal pricing levels for different customer segments.
In revenue management, the goal is to optimize pricing strategies to maximize revenue. This can be achieved by understanding the relationship between price changes and demand dynamics. Mathematically, revenue (R) is the product of price (P) and quantity demanded (Q):

To find the optimal price (P∗) that maximizes revenue, we differentiate the revenue function with respect to price and set it equal to zero:

Solving for P∗ gives us the optimal price:

This equation represents the optimal price that maximizes revenue. Additionally, integrating the demand function over a specified price range provides insights into total revenue generated:

Customer Service: In the context of customer experience, Markov simulation can be used to model the sequence of interactions or states that a customer goes through during their journey with a business. The mathematical equation for Markov simulation involves representing the transition probabilities between different states using a transition matrix (P). Let's consider a simplified example where a customer journey consists of three states: "Browse," "Purchase," and "Feedback." The transition matrix P would be:

where Pij represents the probability of transitioning from state i to state j. The rows of the matrix represent the current state, and the columns represent the next state. Each row of the matrix sums to one, indicating that the probabilities of transitioning to different states from a particular state sum to one.
Marketing Strategies: Mathematical models like the Bass Diffusion Model aid in predicting product adoption. The Bass Diffusion Model can be expressed as:

Where P(t) represents the proportion of adopters at time t, p denotes the coefficient of innovation, q signifies the coefficient of imitation, and m represents the market potential. By leveraging such models, businesses can devise targeted marketing strategies to accelerate product adoption.
Product Management: Linear programming models facilitate optimal product portfolio management. The objective function of a linear programming model may be formulated as:

subject to constraints:

By considering factors such as production costs, demand forecasts, and resource constraints, businesses can determine the optimal mix of products to maximize profitability.
Customer Experience: Markov chain models combined with customer journey mapping offer insights into the customer experience. A simple two-state Markov chain representing the transition probabilities between stages of the customer journey can be represented as:
By analyzing these transition probabilities, businesses can identify areas for improvement in the customer journey and enhance overall satisfaction.
Sustainability Initiatives: Life cycle assessment models quantify the environmental footprint of products and processes. The environmental impact (EI) of a product can be assessed using

Where ECi represents the environmental coefficient of process i, and Qi denotes the quantity of inputs or outputs associated with process i. By integrating such models, businesses can implement sustainable practices and reduce their ecological footprint.
Marketing Strategies: Mathematical models play a pivotal role in guiding marketing strategies, with the Bass Diffusion Model being a prominent example. This model predicts product adoption rates by considering innovation and imitation coefficients, represented as:

Businesses leverage this model to devise targeted marketing campaigns, accelerating product adoption. For instance, tech companies strategically launch new products based on this model's predictions, maximizing market penetration.
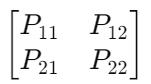
Strategic Management Formulation: Game theory models aid in strategic decision-making. The payoff matrix in a simple two-player game can be represented as:

Lets define the strategies chosen by each player: Let S1 represent the set of strategies available to Player 1, and S2 represent the set of strategies available to Player 2. Then, each player chooses a strategy from their respective set:

Now, let's define the strategies chosen by each player as s1 and s2, where s1 is the strategy chosen by Player 1 and s2 is the strategy chosen by Player 2.
Given the payoff matrix M, the payoff to Player 1, π1, when Player 1 chooses strategy s1 and Player 2 chooses strategy s2, denoted as π1(s1,s2), can be calculated as follows:
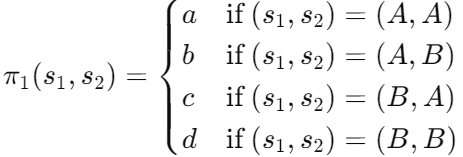
Similarly, the payoff to Player 2, π2, when Player 1 chooses strategy s1 and Player 2 chooses strategy s2, denoted as π2(s1,s2), can be calculated using the same logic.
Once the payoff functions π1 and π2 are defined, we can identify the Nash equilibrium by analyzing the strategies chosen by each player and ensuring that no player has an incentive to deviate from their chosen strategy. Mathematically, a Nash equilibrium is a pair of strategies (s1∗,s2∗) such that:

for all possible strategies s1 and s2. In other words, at a Nash equilibrium, no player can unilaterally improve their payoff by changing their strategy.
Dynamic Pricing: Dynamic pricing models adjust prices in real-time based on demand fluctuations. The demand function (D) in a dynamic pricing model can be represented as:
D=f(P,T,O)
Where P denotes price, T represents time, and O signifies other relevant factors. To optimize pricing dynamically, the company seeks to solve an optimization problem that maximizes total revenue over a specified time period.

where R(P(t)) is the revenue function, representing the product of price and quantity demanded at time t; t1 and t2 denote the start and end times of the pricing period.
The revenue function R(P(t)) can be expressed as:

The optimization problem involves determining the optimal pricing policy P∗(t) that maximizes the integral of the revenue function over the specified time period.
Merchandising Decisions: Assortment optimization models optimize product assortments to maximize sales. The objective function of an assortment optimization model may be formulated as:

Subject to constraints on shelf space and budget allocations. By leveraging such models, businesses can tailor product assortments to meet customer demand effectively.
Hiring Practices: Predictive analytics models aid in predicting employee performance and attrition rates. A logistic regression model predicting employee attrition may be expressed as:

By analyzing factors such as skills, experience, and job fit, businesses can identify high-potential candidates and optimize their hiring practices.
Conclusion: Mathematical modeling serves as a cornerstone for data-driven decision-making across various domains within businesses. By leveraging mathematical models, organizations can optimize operations, enhance customer experiences, and achieve sustainable growth in today's dynamic business environment. From revenue management to strategic management formulation, mathematical modeling offers invaluable insights that drive organizational efficiency and competitiveness.
Comments